To use the Select by Graphics tool, you will need to draw a polygon by clicking the Draw button (see Figure 13) on the “Spatial Filter Toolbar.” Click the map with the left mouse button to add the first point then click on the map to add additional vertices and once more to finalize the graphic. Once the graphic is drawn to the user’s specifications, click the Drawn Area button (Figure 14) to invoke the filtering process for features within the drawn graphic.
Figure 12 – Draw Button
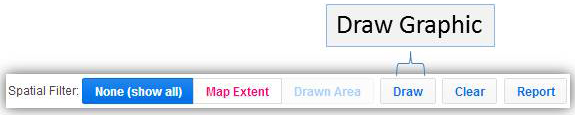
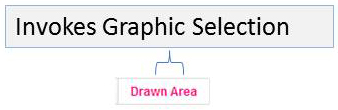
Figure 13 – Drawn Area Button